

The CPI Gave Bulls What They Needed. The Strait of Hormuz Did Not.
Wednesday, 11th of March Report


February inflation came in softer than feared, but three cargo ships were struck in the Strait this morning, and oil has a long memory.
The February CPI landed this morning, and for once the data cooperated. Headline inflation came in at +0.3% month-over-month and +2.4% year-over-year, in-line on the headline and softer than expected on the core, which printed +0.2% MoM versus the +0.3% consensus, per the Bureau of Labor Statistics. That cooler core reading is what the market was watching: shelter inflation moderated, used vehicle prices continued their decline, and services ex-housing showed the first signs of meaningful deceleration since the Iran war began. Bitcoin responded, moving from ~$69,900 pre-data toward $70,500 in the first twenty minutes, before settling into the low $70,000s where it trades now. The March 18 FOMC hold is still locked in at near-certainty, but the softer core briefly pushed June rate-cut probabilities higher on CME FedWatch. That is the constructive read.
The complication arrived by mid-morning. The U.K.’s Maritime Trade Operations reported three cargo vessels struck by projectiles in and around the Strait of Hormuz : one inside the strait itself, one 50 nautical miles northwest of Dubai, and one off the UAE coast, per CNBC. Brent, which had retreated to ~$89 after Tuesday’s Trump comments, ticked back toward $92 on the news before paring gains. The market’s read is that every hour the Strait remains effectively closed, the relief from any single CPI print shortens its shelf life.
1. Macro: What the Soft Core Actually Means (and Doesn’t)
The distinction between headline and core CPI matters more than usual today. The headline reading of +2.4% YoY (unchanged from January) reflects a market that has stabilised below the levels that alarmed the Fed last autumn. The core reading of +0.2% MoM is the real surprise: it is the slowest monthly core print since October 2025 and came in ten basis points below the FactSet consensus of +0.3%. The categories driving it were shelter (+0.2%, continuing its year-long deceleration) and used vehicles (outright deflation again), both of which have been the stickiest components of the post-COVID inflation overhang. As ClearBridge’s Josh Jamner noted ahead of the release, “food and home prices to be cooler” was the expectation, and the data delivered, per Morningstar.
What it does not mean is that the inflation problem is resolved. February’s data was collected before the February 28 Iran strikes. The energy shock that sent oil from ~$70 to $119 in nine days will appear in March CPI (due April 10), not today’s report. Bank of America’s Antonio Gabriel was precise on this point before the release: the February number “won’t give us a whole lot of information on how prices are starting to respond” to the conflict. The market knows it is reading a backward-looking snapshot. The relief in crypto and equities from today’s number will be limited in duration unless oil prices retreat further and stay down. At $86–92 Brent, the March CPI print will still be materially hotter than February’s, the only question is by how much.
The Fed’s framework is unchanged. Two data problems are running in parallel: weak labour (−92,000 NFP, 4.4% unemployment) and an inflationary energy shock, and the institution cannot move on either until both resolve. Today’s Jobless Claims print (expected ~215,000) is a secondary confirmation of the labour picture; watch continuing claims more than initial, as the NFP miss last week may begin to show up in the insured unemployment rolls with a lag.
2. Geopolitics: The Strait Is Not Open
The working assumption from Tuesday’s Trump comments (that the Iran conflict was near resolution) collided with reality again on Wednesday. By Wednesday morning, three civilian vessels had been struck in or near the Strait of Hormuz. One cargo ship suffered a fire and crew evacuation after being hit inside the strait itself. Two drone strikes were also reported near Dubai International Airport, briefly closing airspace, per CNBC. Defense Secretary Pete Hegseth’s statement on Tuesday remains operative: the war will not end until the enemy is “totally and decisively defeated.” That language is not consistent with a resolution this week.
The IEA reserve release (the largest in the agency’s history) has taken approximately $7 off oil prices, per Goldman Sachs analysts, but it buys days rather than months of buffer. Rystad Energy’s Sasha Foss stated the calculation plainly: “these releases really buys us a few days, but in reality, really it all depends on the opening of the Strait of Hormuz.” The actual supply disruption (roughly 20% of global oil consumption transiting the Strait daily) cannot be offset by strategic reserves indefinitely. J.P. Morgan’s framework puts Brent at $110+ if disruption lasts two months, and $135 if it extends to four. Those scenarios would push March and April CPI into territory that changes the entire rate-cut calculus for 2026.
The constructive scenario requires a Hormuz safe corridor or ceasefire agreement, not a presidential press conference. Until one of those materialises, oil’s “war premium” is structural, not temporary.
China’s diplomatic engagement is worth monitoring. Beijing’s special envoy Zhai Jun met Saudi Arabia’s Foreign Minister on Wednesday, urging “unremitting efforts” for Gulf peace and stability, per OilPrice.com. China has the clearest economic incentive to broker a resolution (its oil supply chain runs directly through the Strait) and is the only major power with substantive relationships on both sides of the conflict.
3. On-Chain: DOT Pi Day Halving Is Tomorrow
Polkadot’s “Pi Day” halving arrives on March 14, two days from now. The supply mechanics are real: annual issuance drops from roughly 120 million tokens to 55 million, the inflation rate falls from 6.8% to 3.1%, and a hard supply cap of 2.1 billion DOT is enacted for the first time in the protocol’s history, per the governance vote that passed with 81% approval, per Tron Weekly. The unbonding period for staked DOT also compresses from 28 days to 24–48 hours, freeing up liquidity for validators who have been locked in.
Exchange reserve data for DOT has shown a modest but sustained decline over the past week, consistent with holders moving tokens off exchanges into self-custody ahead of the event, a behavioural pattern that historically precedes supply-side tightening. The 21Shares TDOT ETF, listed on Nasdaq on March 6, has added an institutional access layer that previous Polkadot protocol events lacked. The combination of a binary supply event, an institutional ETF, and a well-publicised narrative creates the conditions for a short-term catalyst trade, not a structural thesis. The “buy the rumour, sell the news” dynamic is the primary risk: well-flagged events in crypto frequently see the sharpest selling at the moment of implementation. DOT sits at ~$1.55 today, up modestly from Tuesday. The level to watch before and after March 14 is $1.99, which represents the first meaningful overhead resistance and the break point that would suggest the halving narrative had legs beyond the event itself.
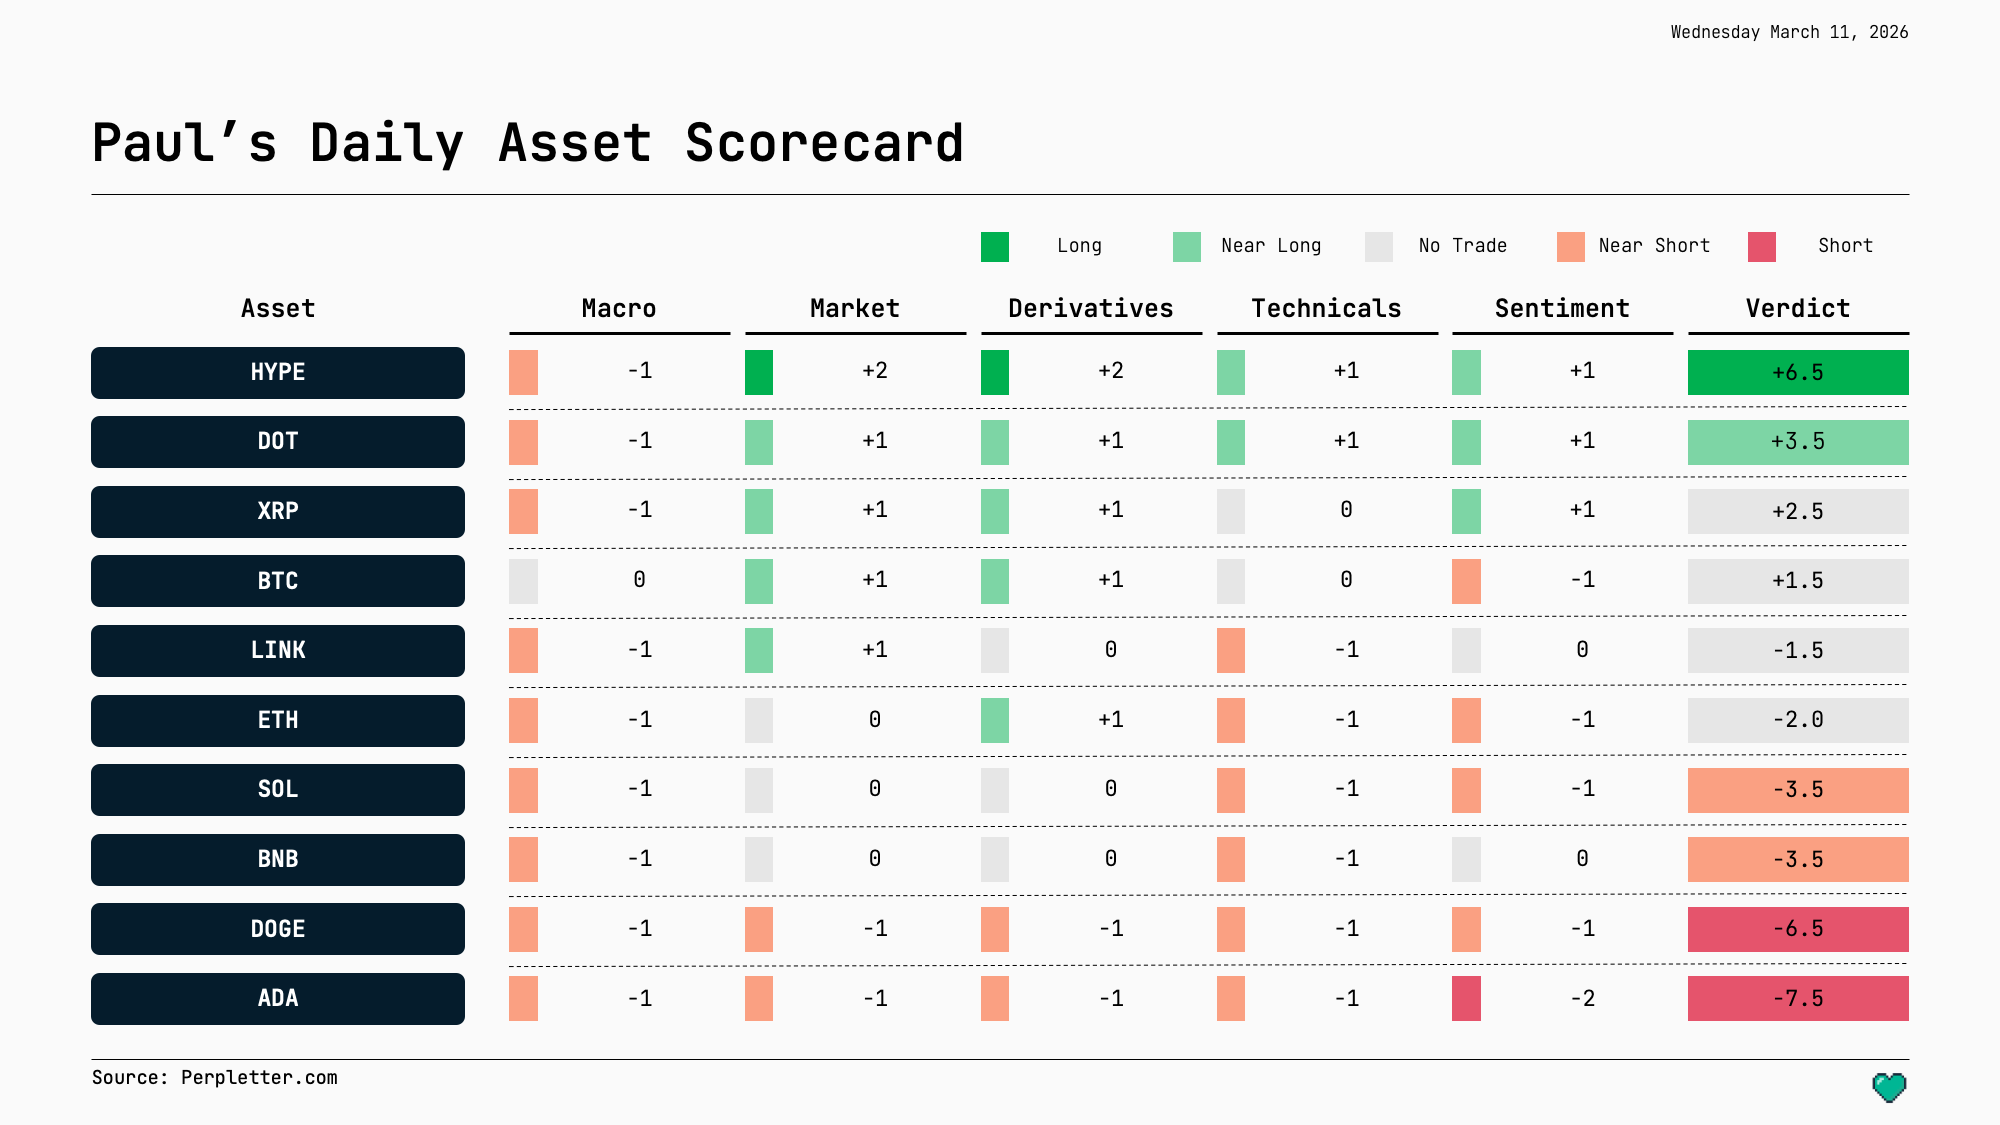
Daily Asset Scorecard
Weighted Score = L1 Macro ×2 + L2 Structure ×1.5 + L3 Derivatives ×2 + L4 Technicals ×1.5 + L5 Sentiment ×1 · Each layer −2 to +2 · Range −18 to +18
Tracked universe: BTC · ETH · SOL · XRP · BNB · LINK · DOGE · ADA · HYPE · TRX · DOT · AVAX · SUI · TON · UNI · WLD · TAO · LTC
BTC and ETH appear every edition. Rotating slots today: HYPE (Long thesis intact), DOT (Pi Day halving tomorrow — final pre-event window), XRP (ETF deadline Mar 27, OI still elevated), SOL (Near Short; technically weak vs. BTC), BNB (Near Short), LINK (No Trade; neutral across layers), DOGE (Short), ADA (Short). Assets reviewed and excluded: TRX, AVAX, SUI, TON, LTC, WLD, TAO (no score movement or active catalyst today).
HYPE · Hyperliquid · +6.5 · Long (unchanged)
No change to score or verdict. HYPE retains its role as the standout long setup in the current environment, the only asset in the scorecard with a strong positive derivatives layer (+2) and structure (+2) simultaneously. Today’s oil move back toward $92 following the Strait incidents is a mild headwind to the macro layer, but the Hyperliquid thesis is not oil-directional. The platform’s utility as the 24/7 oil and risk-asset pricing venue during the conflict is its competitive moat, and that moat deepens with every new session of geopolitical volatility. Note that today’s CPI relief is unlikely to change the setup materially in either direction. HYPE needs the broader macro to stabilise or improve to unlock the next leg, and that depends on Strait developments, not a single CPI print.
DOT · Polkadot · +3.5 · Near Long (score change: +1.0 from yesterday’s +2.5)
DOT upgrades to Near Long as the Pi Day halving enters its final 48-hour window. The technical layer improves to +1 today, price has reclaimed the 20-day moving average and is testing $1.55–$1.58 with modestly rising volume, suggesting the pre-event accumulation thesis is playing out at a small scale. The sentiment layer (+1) remains active: the DOT community narrative around Pi Day is at peak intensity, and the TDOT ETF provides an institutional channel for the event.
The score moves to Near Long, but the verdict comes with a clear discipline note. The “buy the rumour, sell the news” dynamic is the dominant risk for event-driven trades of this kind. Protocol halvings in crypto rarely produce the sustained multi-week rallies that Bitcoin halvings do, because the anticipation infrastructure is thinner and the market is smaller. The actionable trade, if any, is a pre-event position with a defined exit plan at or shortly after March 14. A sustained close above $1.99 post-halving would be a meaningful signal that the thesis has extended beyond event-driven price action. Failure to hold $1.40 on the other side would confirm the “sell the news” pattern and remove DOT from the scorecard rotation until the next catalyst.
BTC · Bitcoin · +1.5 · No Trade (score change: +2.5 from yesterday’s −1.0)
BTC’s score improves meaningfully today on two layer changes. The macro layer moves from −1 to 0 as the in-line/softer CPI print removes the immediate hawkish risk that had been depressing L1 for the past week. The oil shock is still real, but today’s core data provides the first signal that underlying inflation (ex-energy) is continuing to decelerate. The derivatives layer improves from 0 to +1 as funding rates turned modestly positive overnight and open interest is rebuilding cautiously after the prior week’s flush. The technical and structure layers are unchanged: BTC above the 50-day EMA, long-term holder selling subdued, but the 200-day EMA and $73,000–$74,000 resistance remain overhead.
The No Trade verdict is correct. The score is improving, but the geopolitical risk is still live, as demonstrated by the morning Strait incidents. A BTC position here is a bet that the oil situation stabilises further, and that is a macro call, not a crypto call. BTC’s path remains clear: a soft March CPI (April 10) and Strait reopening could drive a push toward $73,000–$75,000; a hot March CPI or oil re-escalation resets the picture. Do not front-run the resolution.
XRP · Ripple · +2.5 · No Trade (score change: +1.0 from yesterday’s +1.5)
XRP’s sentiment layer improves to +1 today as the community reaction to the soft core CPI is positive, and the SEC ETF deadline on March 27 is now 15 days away, close enough to generate active positioning without yet triggering the “event has passed” dynamic. The derivatives layer (+1) remains supported by open interest near its post-February-24 high. The macro headwind (L1: −1) eases slightly but does not turn positive given the ongoing oil volatility. XRP continues to be the most fundamentally supported asset in the No Trade zone. Deutsche Bank, Aviva, and Société Générale integrations are real, the ETF deadline is near, and the CLARITY Act is progressing. The score is approaching Near Long territory (+3.0) but has not arrived. The trigger to watch: a confirmed close above $1.50, which has capped the recovery since the initial Iran shock.
ETH · Ethereum · −2.0 · No Trade (score change: +1.5 from yesterday’s −3.5)
ETH’s derivatives layer improves to +1 today: funding rates are neutral to slightly positive and open interest is rebuilding alongside the broader market relief from CPI. This is a meaningful shift from the Near Short verdict of recent sessions. The technical layer (−1) remains the drag. ETH has failed to sustain closes above $2,050 and continues to underperform BTC and SOL on both upside and downside percentage moves. The score moves to No Trade, but the verdict is passive. ETH is not a compelling entry in either direction until it either breaks $2,100 with conviction or loses $1,900 support. The structural underperformance vs. the broader market is the ongoing narrative, and one CPI print does not change it.
ADA · Cardano · −7.5 · Short (unchanged)
All five layers remain negative. No catalyst on the horizon. Short verdict held.
DOGE · Dogecoin · −6.5 · Short (unchanged)
Four negative layers plus macro headwind. Short verdict held. The only variable that could rescue this signal is an exogenous social media event; today’s CPI relief provides no fundamental support.
Sources
Morningstar — February CPI Report Forecasts Call for Slight Inflation Uptick
CNBC — S&P 500 Live Updates: Cargo Ships Struck in Strait of Hormuz, March 11
CNBC — Oil Ticks Higher as Markets Await Historic Reserve Release
CNN — Oil Prices Dive as Trump Says Iran War Will End ‘Very Soon’
OilPrice.com — Brent Falls Below $90 as Trump Signals War May End
crypto.news — Bitcoin Price Outlook After US CPI Data Release Today
Tron Weekly — Polkadot Sets 2.1 Billion DOT Cap in Economic Overhaul
Spoted Crypto — Fear & Greed Index Hits 12: 6 Data-Backed Crypto Buy Picks
CoinDesk — Bitcoin Market Bottom May Be Nearing, Measured Against Gold
Perpletter is published for informational purposes only and does not constitute investment advice. Do your own research.